

As of 9/30/2022, the data included in this tool is under review and in the process of being updated. We encourage users to reference original data sources for citations until this process is complete, and thank you for your patience as we ensure all data is current and accurate. For questions regarding the Data for the People Hub or data contained therein, please contact [email protected].
Our Data for the People Hub aims to bridge the gaps that often exist between identifying challenges and identifying targeted solutions. We’ve compiled commonly referenced early education, K-12, and higher education public data sources into a series of data visualizations that paint a comprehensive picture of California’s educational landscape. We invite state policymakers, community partners, families and students, educators, district and school leaders, and other advocates to use this tool to inform their conversations about education equity in order to move toward solutions.
How to Use the Tool
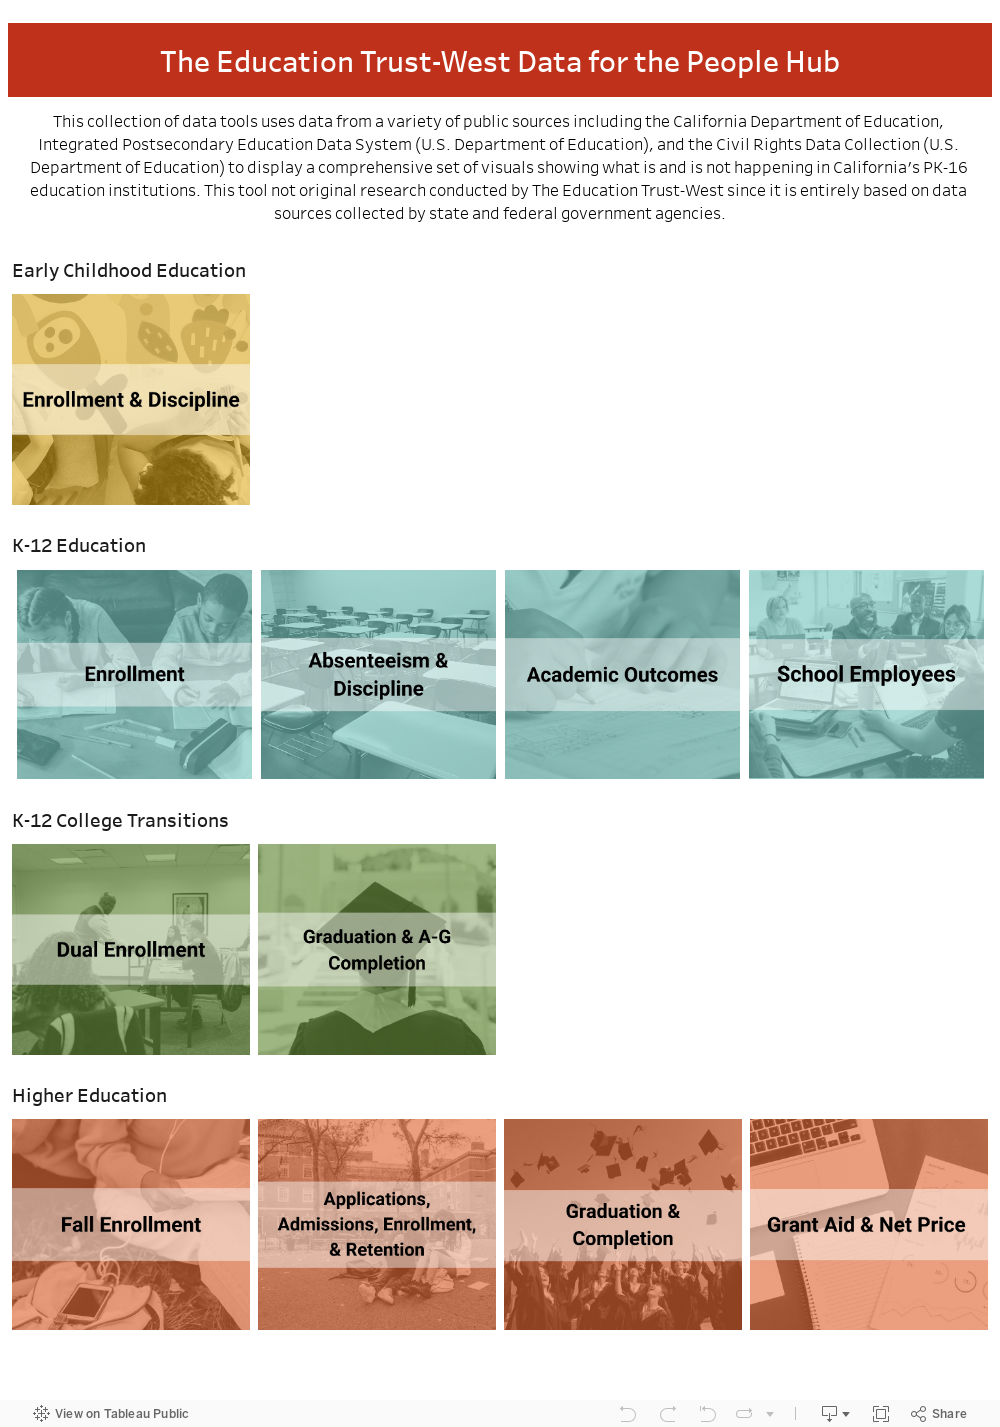
This comprehensive tool uses data from various public sources to display a thorough set of visuals that reveal important insights about California’s early education through higher education systems. Each dashboard provides a variety of data points at the state, county, district, and school/institution level for users to explore.
This tool is best viewed on a desktop or laptop. We recommend starting at the Table of Contents and navigating to specific dashboards based on data interests.
- The drop down filter options on the right hand side (Reporting Level, County, District, School, Institution) allow users to zoom in on data relevant to their own context and needs.
- The “Reporting Level” filter allows users to select the level of detail that they’d like to view. From there, users can select individual counties, districts, and schools to create more granular snapshots.
Click here to view the tool on the Tableau Public website
About This Data
These tools are based on publicly available data sources. The source note at the bottom of each visual provides information about where users can explore the data further.
We aimed to provide data at the state, county, district, and school level for the past five years, up to the most recent year that data are available. While this tool is updated periodically to reflect the most recent and publicly available data, there may be a lag between data hub updates and data releases. Given delays in data availability or the absence of data collection in recent years, the most recent data year varies by indicator.
We did our best to match our results to available online data (i.e., CDE and IPEDS web databases). There may occasionally be slight discrepancies between downloadable data files and data provided online due to differences in data reporting standards. If data is “missing” from the visual this means it was suppressed in the underlying data file because of data reporting requirements. However, there may be instances where that data is reported on DataQuest. We recommend referring back to the original data source if you encounter any discrepancies.
Additional details about the methodology for specific indicators can be provided upon request.
Acknowledgments
We would like to thank Nancy LePage at Claremont Graduate University, who created this series of data tools in partnership with The Education Trust–West as a part of her Master’s in Education Capstone Project in spring 2021.


